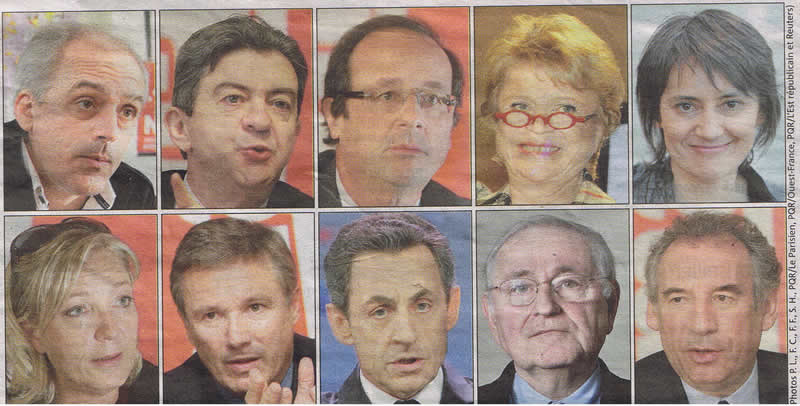
| Résultat des Présidentielles des 22 avril et 6 mai 2012 sur le canton de Rians |
| |
 |
| |
| Les résultats du 1er tour : |
| |
| |
Artigues |
Ginasservis |
Rians |
Saint-Julien |
La Verdière |
Vinon/Verdon |
TOTAL |
| INSCRITS : |
198 |
1 166 |
3 393 |
1 635 |
1 220 |
3 084 |
|
| VOTANTS : |
179 |
1 000 |
2 672 |
1 389 |
985 |
2 512 |
|
| EXPRIMES : |
178 |
987 |
2 621 |
1 367 |
967 |
2 452 |
|
| PARTICIPATION (%) : |
90.40 % |
85.76 % |
78,75 % |
84.95 % |
80.74 % |
81.45 % |
|
| |
| HOLLANDE François (PS) |
19
10.67 % |
217
21.99 % |
566
21,59 % |
262
19.17 % |
192
19.86 % |
590
24.06 % |
|
SARKOZY Nicolas (UMP) |
55
30.90 % |
274
27.76 % |
647
24,69 % |
348
25.46 % |
233
24.10 % |
631
25.73 % |
|
| BAYROU François (MODEM) |
10
5.62 % |
50
5.07 % |
148
5,65 % |
88
6.44 % |
46
4.76 % |
175
7.14 % |
|
| LE PEN Marine (FN) |
64
35.96 % |
256
25.94 % |
778
29,68 % |
439
32.11 % |
321
33.20 % |
672
27.41 % |
|
| MELENCHON Jean Luc (FG) |
18
10.11 % |
148
14.99 % |
341
13,01 % |
157
11.49 % |
122
12.62 % |
281
11.46 % |
|
| JOLY Eva (EELV) |
2
1.12 % |
9
0.91 % |
48
1,83 % |
18
1.32 % |
20
2.07 % |
28
11.14 % |
|
| DUPONT-AIGNAN Nicolas (Debout la République) |
8
4.49 % |
18
1.82 % |
55
2,10 % |
30
2.19 % |
16
1.65 % |
43
1.75 % |
|
| ARTHAUD Nathalie (LO) |
0
0 % |
3
0.30 % |
9
0,34 % |
12
0.88 % |
4
0.41 % |
13
0.53 % |
|
| POUTOU Philippe (NPA) |
1
0.56 % |
9
0.91 % |
22
0,84 % |
11
0.80 % |
12
1.24 % |
14
0.57 % |
|
CHEMINADE Jacques
(S et P) |
1
0.56 % |
3
0.30 % |
7
0,27 % |
2
0.15 % |
1
0.10 % |
5
0.20 % |
|
| |
| Les résultats du 2ème tour : |
| |
| |
Artigues |
Ginasservis |
Rians |
Saint-Julien |
La Verdière |
Vinon/Verdon |
|
| INSCRITS : |
200 |
1 166 |
3 383 |
1 635 |
1 220 |
3 084 |
|
| VOTANTS : |
177 |
975 |
2 711 |
1 357 |
979 |
2 504 |
|
| EXPRIMES : |
158 |
906 |
2 532 |
1 274 |
903 |
2 338 |
|
| PARTICIPATION (%) : |
88.50 % |
83.62 % |
80,14 % |
83 % |
80.25 % |
81.19 % |
|
| |
 |
48
30.38 % |
413
45.58 % |
1 178
(46,52 %) |
544
42.7 % |
415
45.96 % |
1 084
46.36 % |
|
|
110
69.62 % |
493
54.42 % |
1 354
(53,48 %) |
730
57.3 % |
488
54.04 % |
1 254
53.64 % |
|


